CDK2 Ramachandran
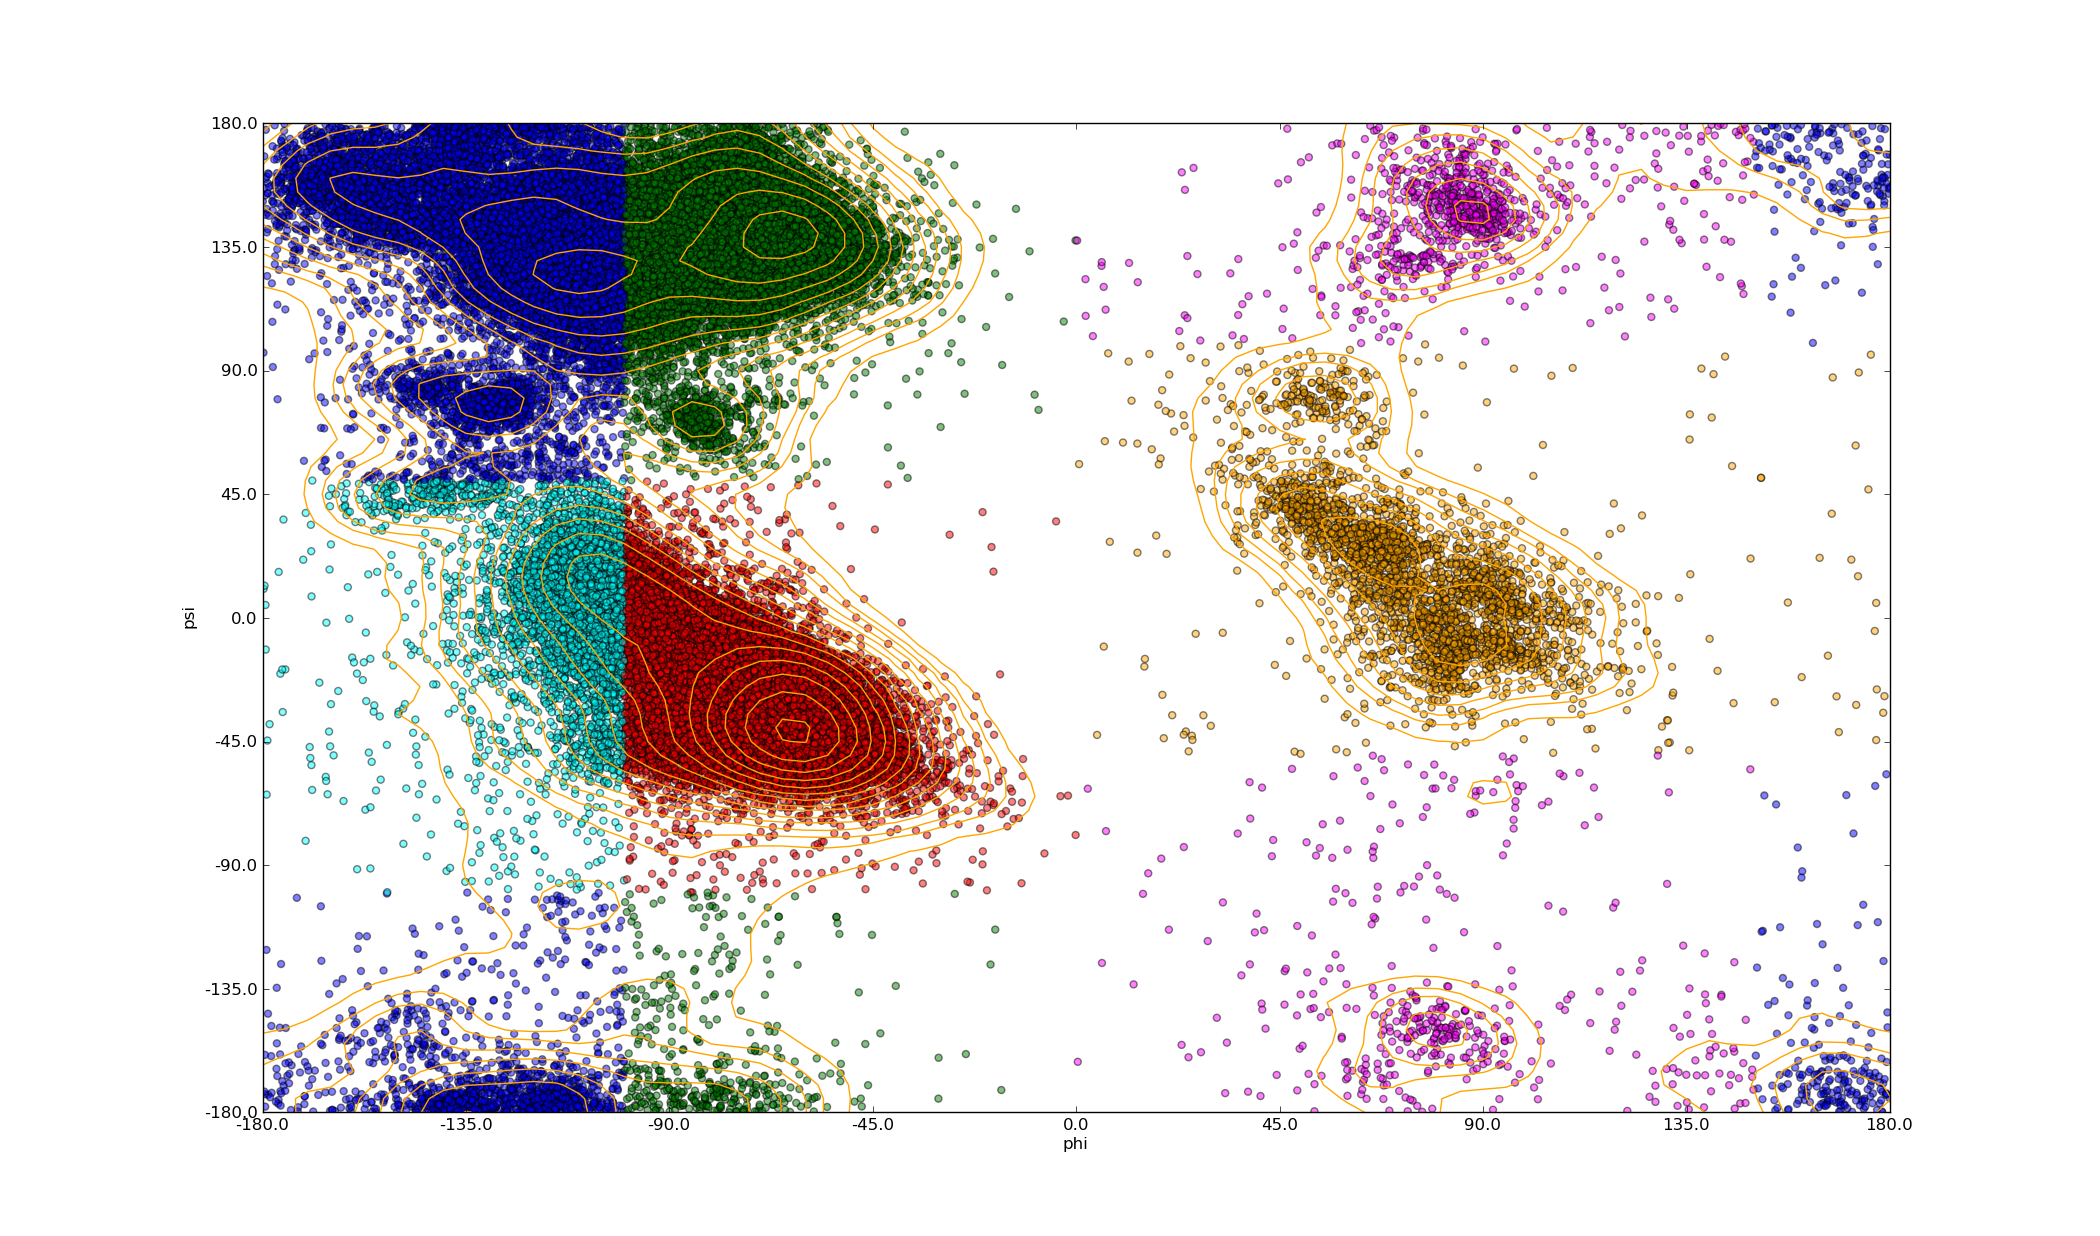
- Make a Ramachandran plot of all residues in all chains. Classify each residue by phi/psi combination as defined in North, B.; Lehmann, A.; Dunbrack, R. L. Journal of Molecular Biology 2011, 406, 228-256. Contours are at Fibonacci numbers.
polyphony_plot_Ramachandran.py -f clust_1HCK_A_95.fasta -p phipsi
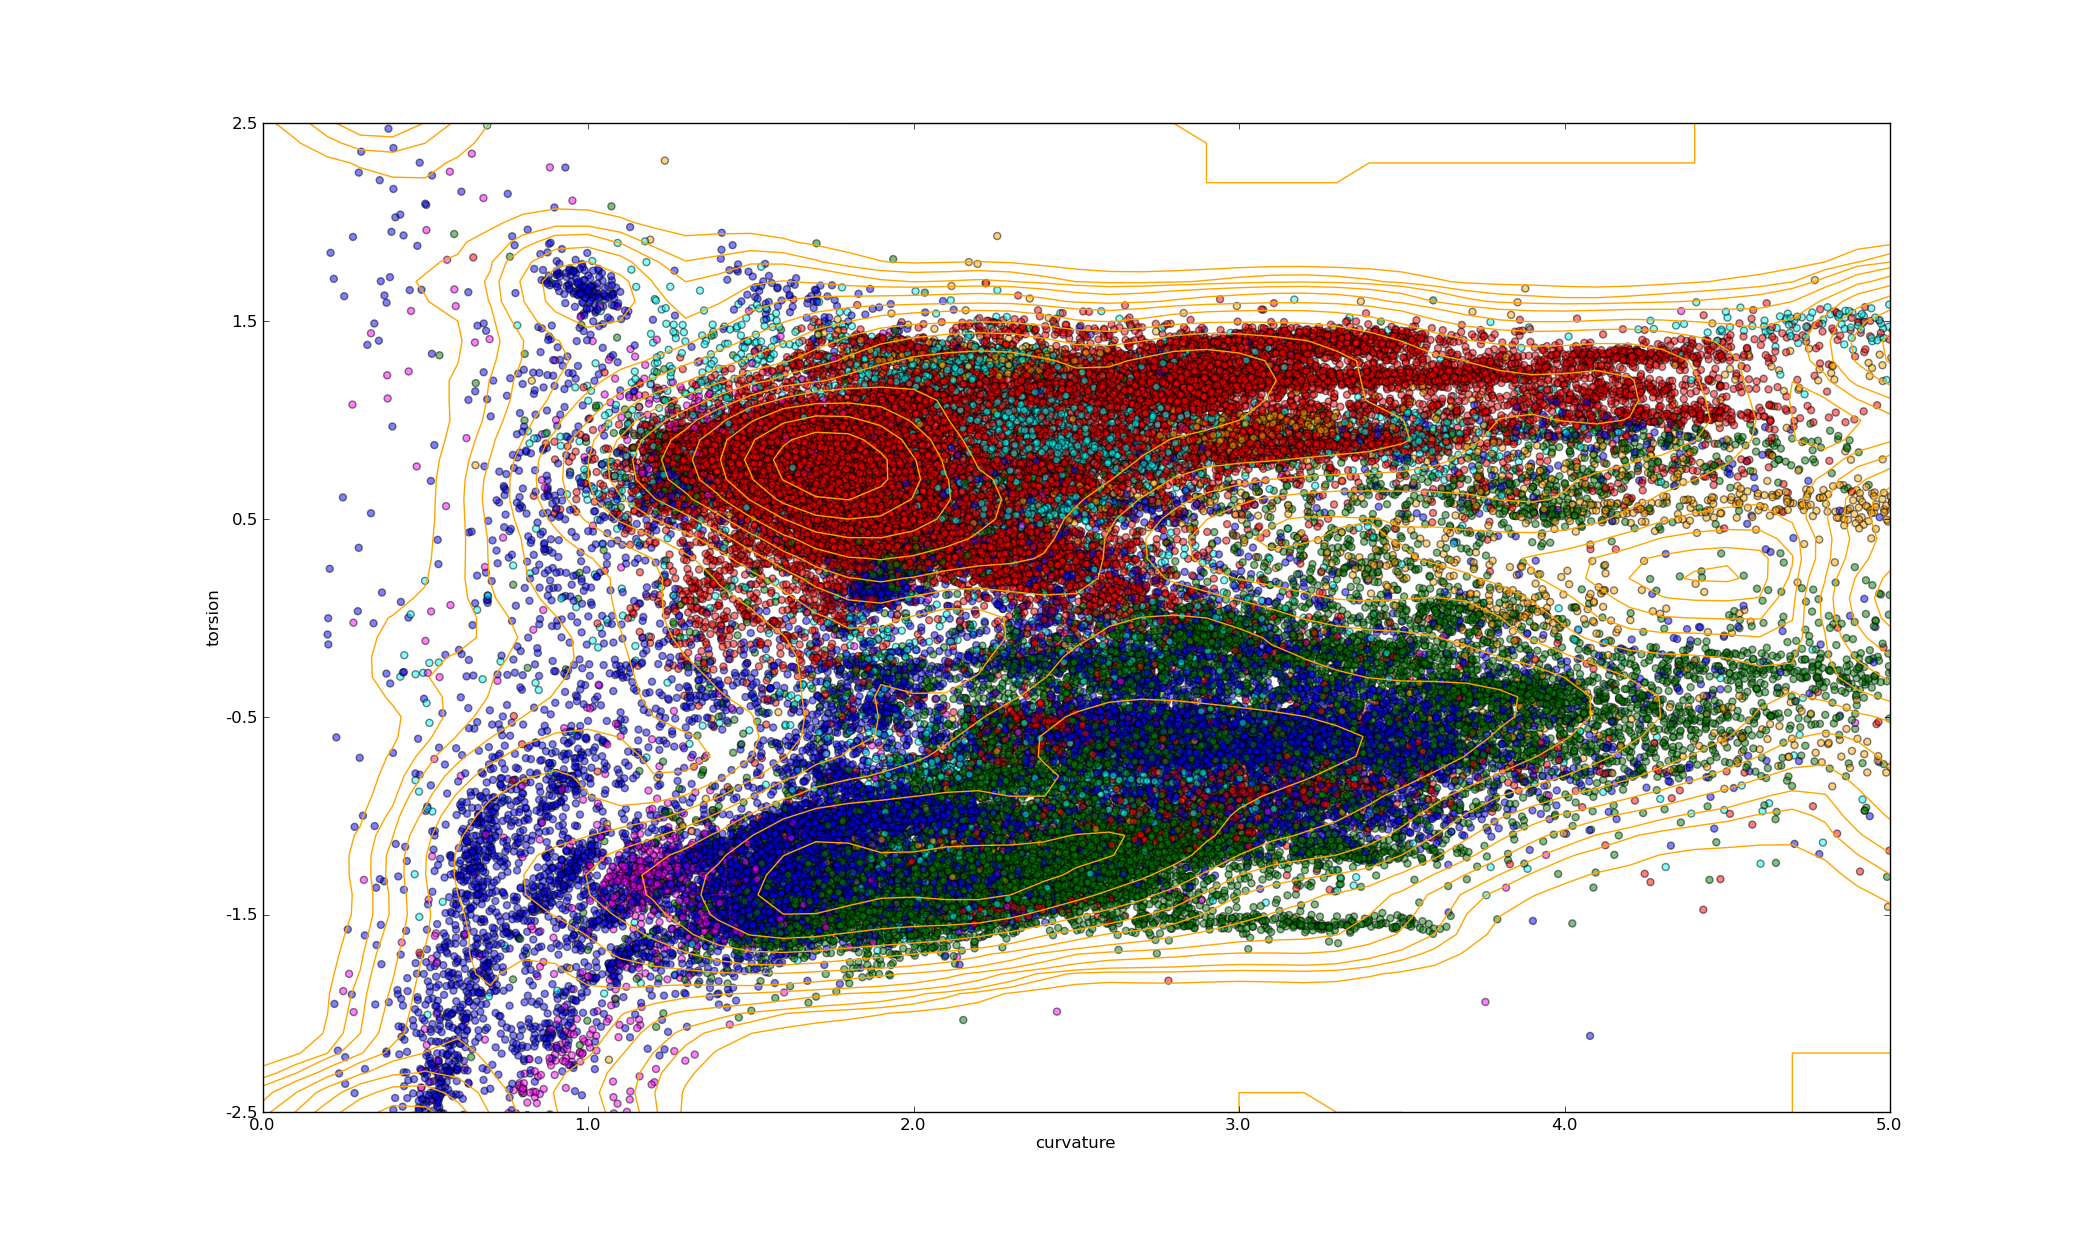
- Plot a scatter plot of curvature against torsion for every c-alpha atom in all chains, coloured by region of the Ramachandran plot.
polyphony_plot_Ramachandran.py -f clust_1HCK_A_95.fasta
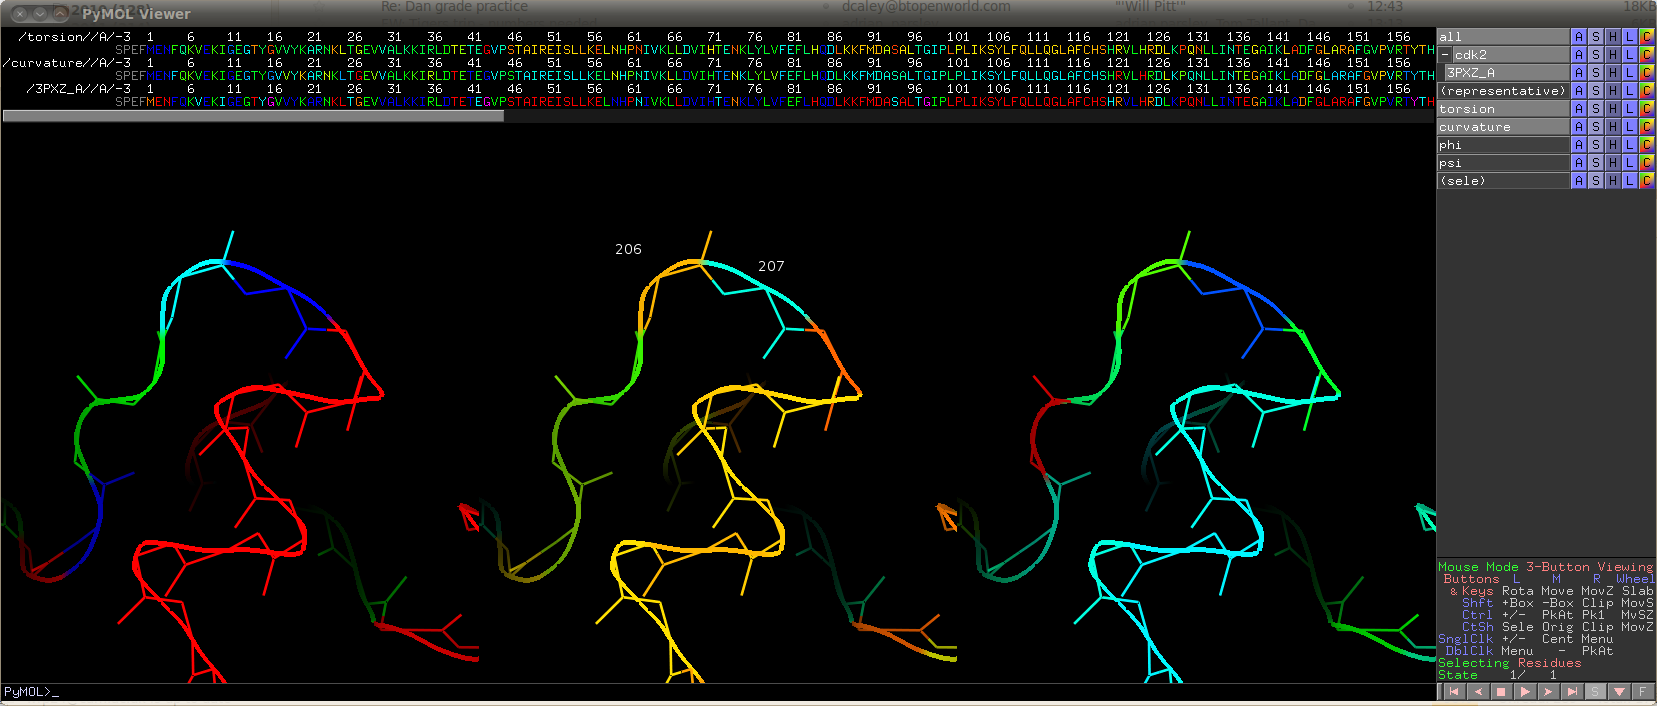
- View in 3D in PyMol. Start pymol -R and in another window a ipython session
from Polyphony.Pymol import Pymol_Viz
cdk2 = Pymol_Viz("clust_1HCK_A_95.fasta","cdk2")

# Colour by torsion
cdk2.colour_single_structure_property(property="backbone", dimension=0)

# Duplicate object in Pymol. Then colour by curvature.
cdk2.colour_single_structure_property(property="backbone", dimension=1)

# Duplicate object in Pymol. Then colour by Ramachandran region (same as 2D plot above)
cdk2.colour_by_Ramachandran_region()